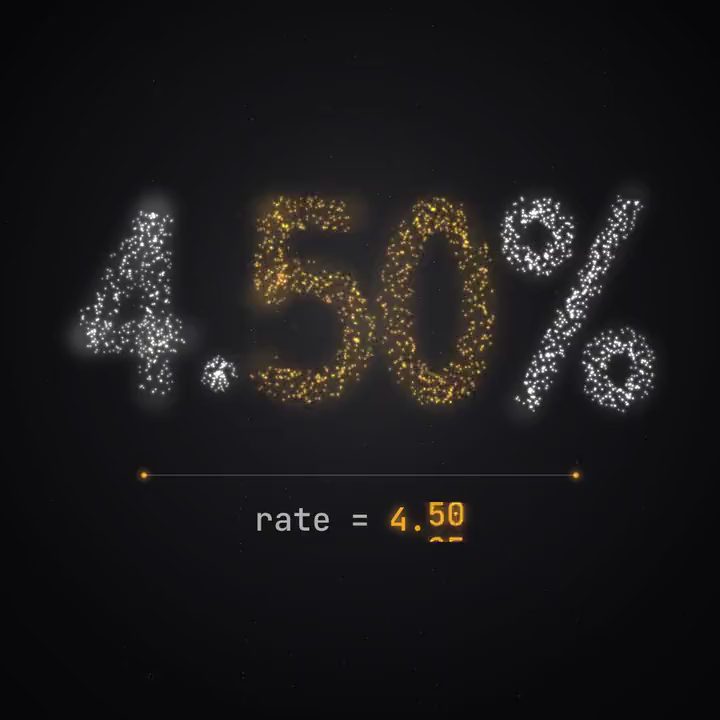
A savings app's best ad counts up to its rate, 4.50%, over the app's balance screen, in five placements and four languages. On Monday the rate drops to 4.25%, and every one of those twenty versions is wrong.
In an ad for a finance, sports, news or weather app, the number is the claim, and it's also the part that changes most often: rates weekly, scores nightly. A wrong figure isn't just stale. In finance it can be a breach. The ASA ruled against a crypto ad claiming up to "8.5% p.a." because it didn't say what the rate depended on, and it requires past performance to be representative (ASA). In October 2026 it banned an ad for the AI Scorecast app that claimed "97% accuracy" in predicting football results, because the ad as a whole implied users would profit and never said they could lose money (ASA).
The obvious fix doesn't work. A number drawn into the picture by a video model can't be trusted to come out right; in VTR-Bench, published in October 2026, the best of 11 video models got one on-screen word in four wrong (AI Weekly).
The number as a value
Most data ads use a handful of moves: a counter that climbs to a rate, a bar that grows to its height, a score that ticks over, a line that draws itself across a chart. Built in Motn, each is motion code, and the number it lands on is data the code reads.
So on Monday someone types 4.25%. The counter stops at 4.25%, the bar settles at its new height and the label updates, with the easing and timing the team approved. Nothing else in the ad moves, so the review covers one figure, not twenty videos. The qualifier next to it, "AER, variable", and any past-performance warning sit beside the number as live text, word for word as legal approved them (why disclaimers must be live text).
The same value feeds every version. The 9:16, 4:5 and 16:9 cuts read the same number, and each market writes it its own way, with a decimal comma in Germany or the currency symbol after the figure in France. Where the figure comes from a feed, such as a leaderboard or a table of results, a data node on the canvas can supply it, so this week's numbers go into the same animation as last week's.
Scores and results
A sports app's result. The morning after a match, the ad shows the final score ticking into place over a clip of the winning goal. The animation was approved once, and each matchday only the team names and the score change. A weekly leaderboard works the same way, as in the golf example in connecting the nodes.
A news or weather app's figure. A forecast ad animates tomorrow's high for each city where it runs, and a news app's ad counts up to the number of stories it covered that week. The figure differs by market or by day, and the motion around it doesn't.
Start with the data ad your team updates most often and rebuild it with the figure as a value. The next time the number changes, change it in one place and look at what moved. More for apps is in Motn for apps.